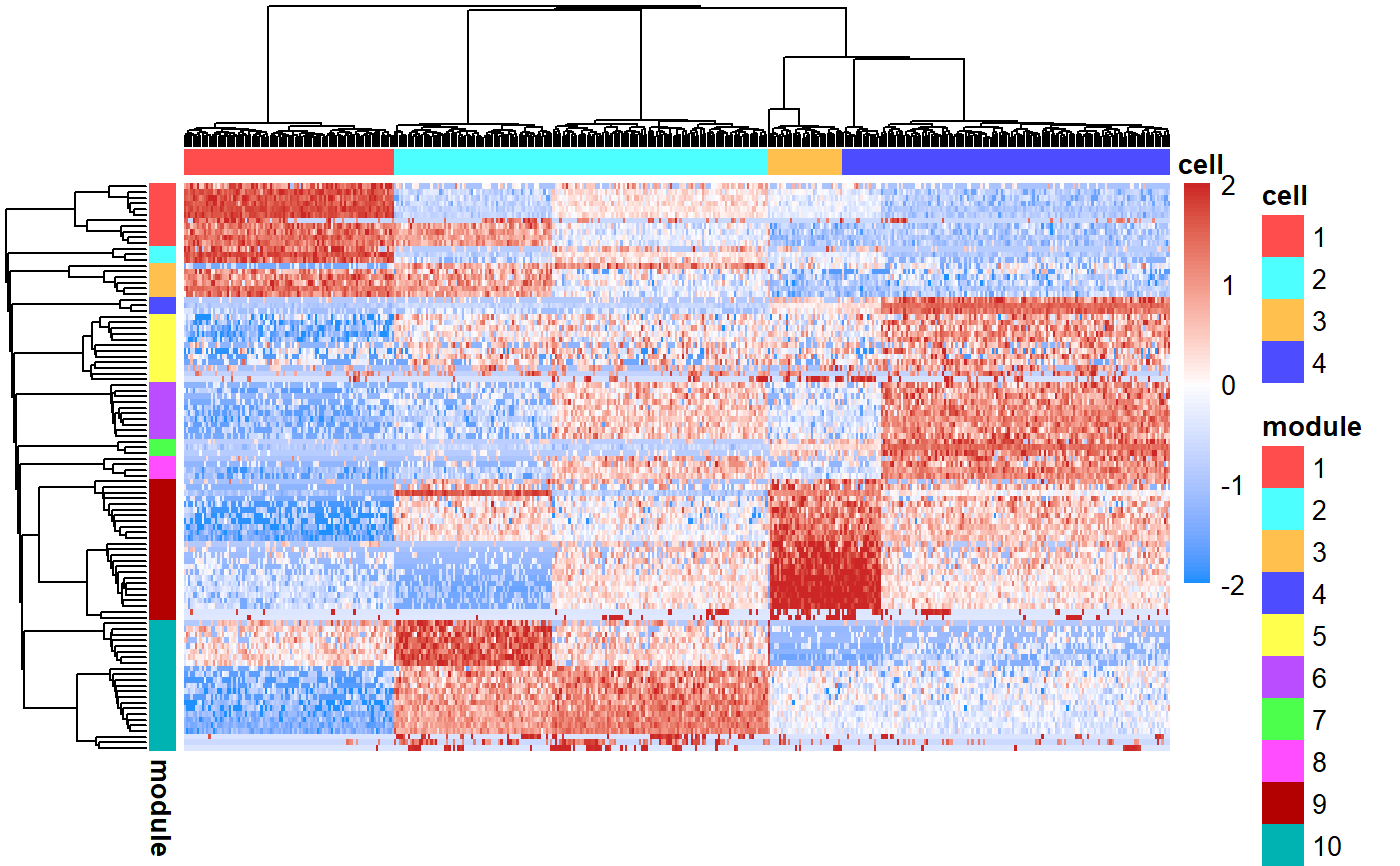
Render a stylable heatmap of count data based on celda clustering results.
    
     
    celdaHeatmap(counts, celda.mod, ...)
    
    Arguments


      | counts | 
      Integer matrix. Rows represent features and columns represent cells. This matrix should be the same as the one used to generate `celda.mod`.  | 
    
    
      | celda.mod | 
      Celda object of class "celda_C", "celda_G", or "celda_CG".  | 
    
    
      | ... | 
      Additional parameters.  | 


    Examples
    #> --------------------------------------------------------------------
#> Starting Celda_CG: Clustering cells and genes.
#> --------------------------------------------------------------------
#> Thu Sep 06 12:55:35 2018 .. Initializing chain 1 with 'random' (seed=12345)
#> Thu Sep 06 12:55:35 2018 .... Determining if any cell clusters should be split.
#> Thu Sep 06 12:55:35 2018 .... Cluster 4 was reassigned and cluster 3 was split in two.
#> Thu Sep 06 12:55:35 2018 .... Determining if any gene clusters should be split.
#> Thu Sep 06 12:55:36 2018 .... Cluster 2 was reassigned and cluster 9 was split in two.
#> Thu Sep 06 12:55:36 2018 .... Completed iteration: 1 | logLik: -1272652.93151523
#> Thu Sep 06 12:55:36 2018 .. Finished chain 1 with seed 12345
#> --------------------------------------------------------------------
#> Completed Celda_CG. Total time: 0.7055938 secs
#> --------------------------------------------------------------------
celdaHeatmap(celda.sim$counts, celda.mod)