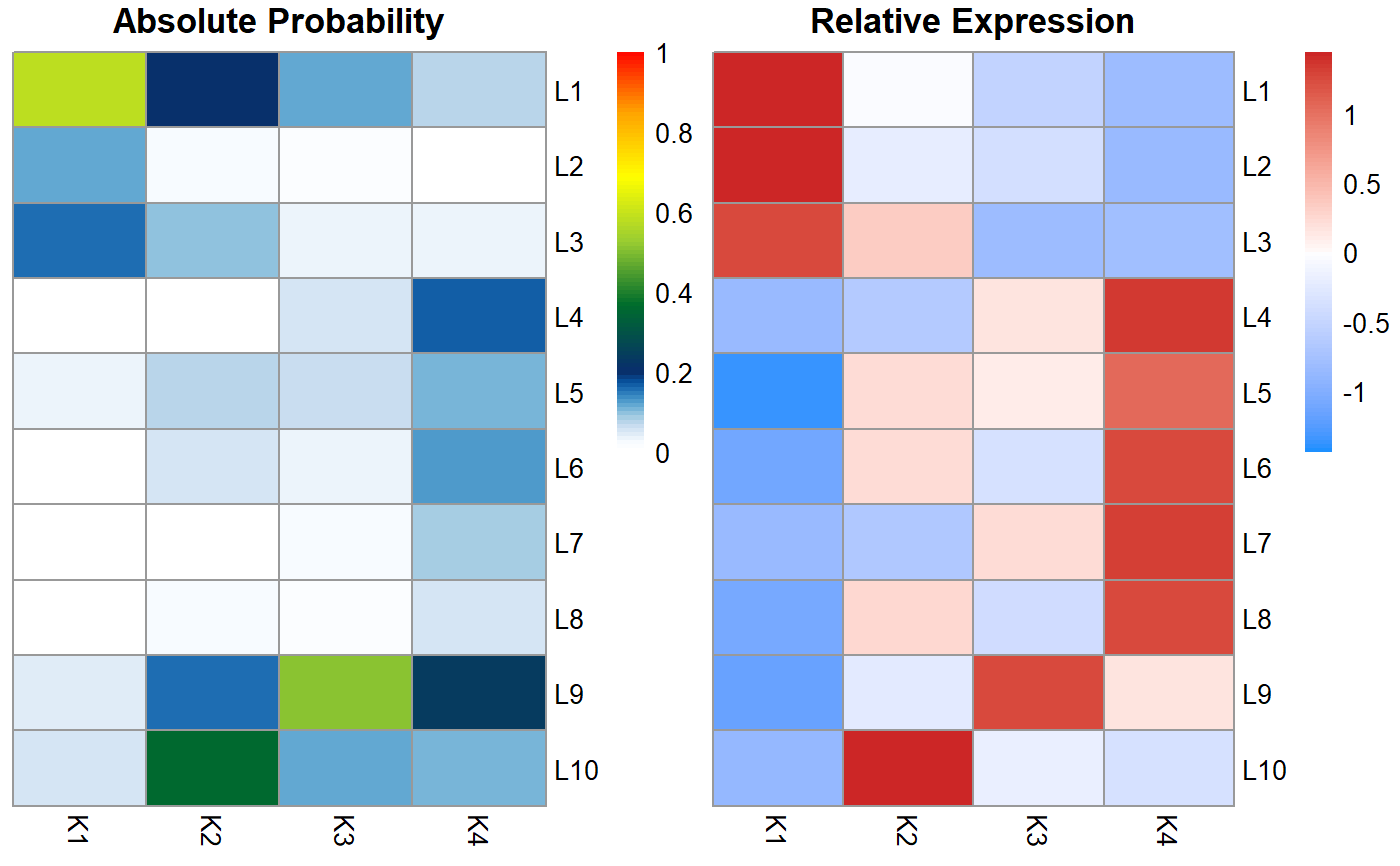
Renders probability and relative expression heatmaps to visualize the relationship between feature modules and cell populations.
celdaProbabilityMap.RdIt is often useful to visualize to what degree each feature influences each cell cluster. This can also be useful for identifying features which may be redundant or unassociated with cell clustering.
celdaProbabilityMap(counts, celda.mod, ...)
Arguments
| counts | Integer matrix. Rows represent features and columns represent cells. This matrix should be the same as the one used to generate `celda.mod`. |
|---|---|
| celda.mod | Celda object of class "celda_C" or "celda_CG". |
| ... | Additional parameters. |
Examples
celda.sim = simulateCells("celda_CG") celda.mod = celda_CG(celda.sim$counts, K=celda.sim$K, L=celda.sim$L, nchains=1, max.iter=1)#>#>#>#>#>#>#>#>#>#>#>#>#>celdaProbabilityMap(celda.sim$counts, celda.mod)